")


How do you know if your marketing activities are working? One I sometimes struggle with is Twitter. The content moves so fast and I don’t feel I know if my short ramblings have just disappeared in the fast flowing action or if they’re actually doing something.
Many businesses only look at the increase in the number of their followers. Although this might show how you’re becoming more visible it can sometimes pay to dig a little deeper. If you want to know if you’re engaging others then there are some other numbers that over time can be beneficial to watch as they can tell you if your marketing tactics are on the right track or if you should make some changes.
What Key Performance Indicators might it be useful to monitor to know whether what you’re posting is engaging and how do you get access to them?
To get hold of your Twitter numbers you can go to https://analytics.twitter.com log in to your account and then choose Tweets from the top menu
Now you can investigate your Impressions, Engagements and Engagement Rate for the last few months on screen. The main chart is the number of Impressions per day i.e. the number of times other users saw your Tweets on Twitter, so a gauge of your reach.
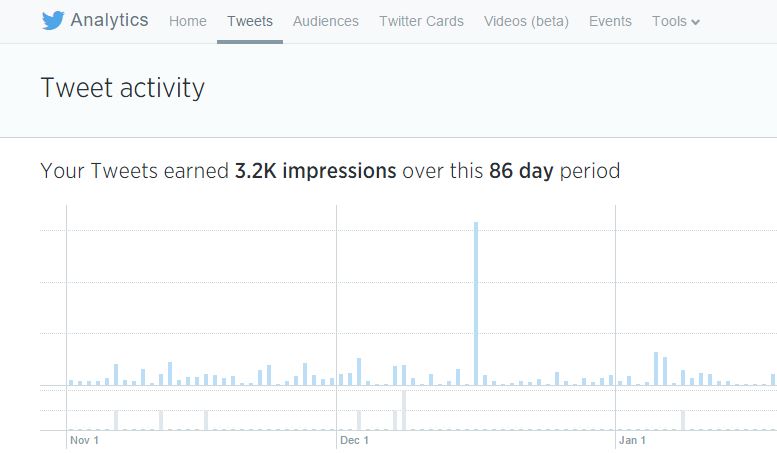
You can see some other charts down the side of the screen. Engagement includes any clicks on your Tweet, retweets, replies, follows and likes. Retweets can be important as they show when your content may be seen be others that are not part of your network. Link clicks are also good to track as that will show you the type of content that is pushing traffic to your website.
You will also see a figure for Engagement rate, which is Engagement divided by the number of impressions and so this is a measure of how attractive your content is.
However, looking at the straight feed of data on screen may not give you enough information as you can’t perform your own calculations or ratios. What if you want to group your data by week, or month? What if you want to see what type of posts had the most impact?
I’m going to show you how you can get the data and make your own quick charts, that once created you’ll be able to update month by month and visualise some other useful statistics.
You can download your Tweet activity by choosing a date range and clicking Export data. Now you have a .csv file. Save it as an Excel Spreadsheet instead to follow along with the rest.
Open it up and you’ll see columns of all the metrics. Each tweet will be itemised on a separate row.
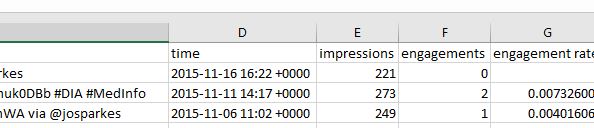
The only thing to slow us down is that the date of our Tweet is in a text format that initially Excel won’t recognise as a date. It won’t take long to fix that though.
Click on column E and press Ctrl + twice to insert two new columns
In cell E2 type
=LEFT(D2,10)
This will copy just the date information from the date in cell D2 i.e. the first 10 characters. We don’t need the time for this exercise
In cell F2 type
=DATEVALUE(E2)
If you just get a number, not a date, right click then select “format cells” then choose “date” as the format.
Now select E2 and F2 together, grab hold of the tiny box in the bottom right hand corner of your selection and drag it down to the bottom of your data. Your formulas will copy down across all the rows.
Now say we want to analyse total engagements by month
Select columns F to H from the top to the bottom of your data
From the main menu choose Insert then Pivotchart from the Charts section
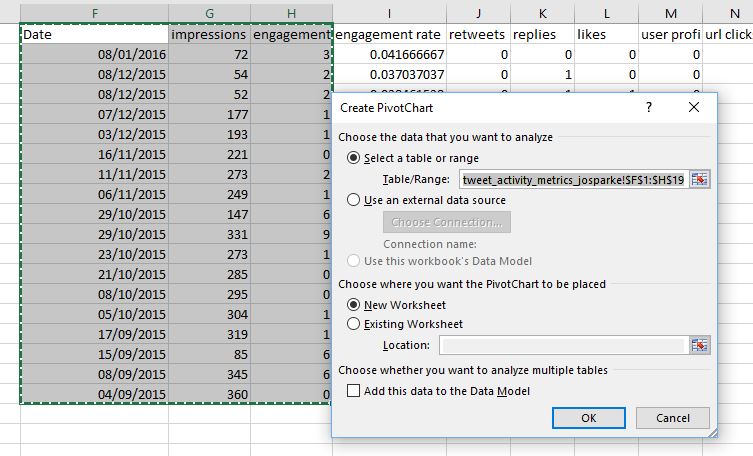
Click OK and on a new worksheet you’ll have a blank looking box on the worksheet and you should see the PivotTable fields on the right hand side
From the field list, drag “Date” to the Axis section (bottom left) and “engagements” to the Values section (bottom right). Excel should automatically split your dates into Years, Quarters and Date.
Your chart will appear on the worksheet and will initially be grouped by Year
Click the little square plus-sign next to the Year value to expand out to Quarters and then again to expand to Month. Your chart will change to match.
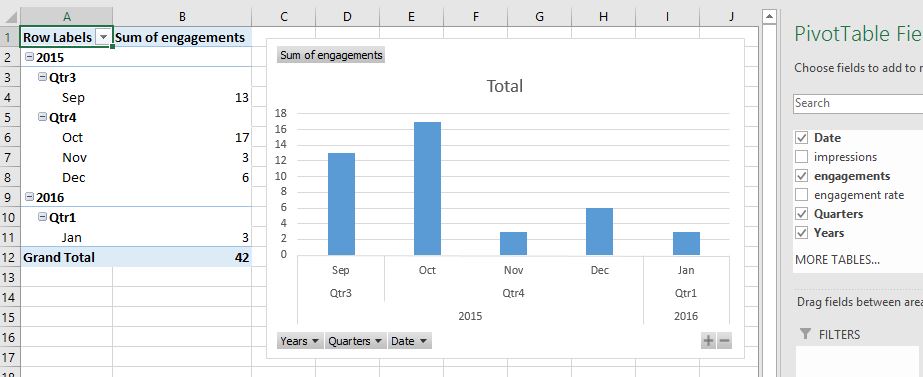
Now I can see that if I value my Twitter engagement I have some work to do as a lot of traction has been lost since October!
You can create as many charts as you need for your own mini dashboard, using the same method.
Since you can see all the text of your tweets you could create a new column in the original data and give every tweet a category e.g. how to tip, technology, motivational, funny etc and then you could create a new chart that shows the engagement by category. Combining your metrics like this can have you well on your way to understanding what interests and motivates your audience – and do more of it.
Add newly available data in to your spreadsheet every month and you will soon have a set of charts updating automatically with a visual view of progress, and the ability to analyse it again in as many ways as you like.
Leave a Reply


@JOANNE.SPARKES
on Instagram
Follow Along